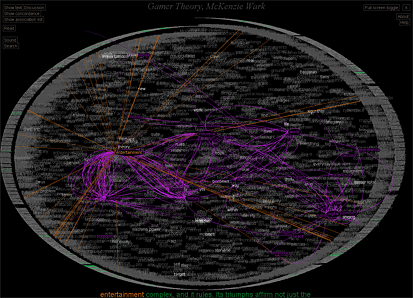
We've had a guest lecturer with the almost aristocratic name Bradford Paley come in to speak to us. His work is currently rubbing frames with that of Flash God Jonathan Harris and other computer graphic designers at the MoMA's "Design and Elastic Mind" exhibition and exhibits quite a different approach to reading of Lewis Carroll's Alice in Wonderland .
So the question is: Who the eff cares about a bunch of colorful lines that tie togther words used in Caroll's drug-glorifying fairy tale? Well, how many literature and creative writing majors are there in the world who've gotten stupidly excited about interpreting the written words of their idols?

Let's back up: Mr. Paley's Text Arc is a visual representation of the occurence and frequency of each word used in Alice in Wonderland. The round frame of the image is made of the entire text of the book. The words inside the cirlce are sized according to occurence frequency (the more often the words appear the larger they are) and are placed onto the graph according to how often they appear at that point in the book. It's almost like elastic bands that stretch throughout the circular layout of the text pulling each word a certain direction.
The most interesting part about this is that the word "Queen" for instance appears at several points in the book before she even appears in person in the fictional storyline. The word in the Text Arc is positioned very close to where she actually appears as Carroll uses the word "Queen" more often when she is actually present in the plot. But the red strings show you where else in the book the Queen has been mentioned and shows how Carroll foreshadows the Queen's final appearance throughout the entire book.
Visual languages
Now that in itself might be nice and gimmicky, but what I found 'stupidly exciting' about this was that Paley created this visual vocabulary or information narrative structure which takes advantage of instant visual recognition of patterns. True, the structure is like Hebrew to a native Chinese speaker at first and has to be learned. But once you get what exactly he's visualizing, basically once you learn how to read this sucker, you can quickly pick up patterns within the data.
We learn how to read bar charts and line charts and by interpreting them formulate certain hypotheses about what this data could mean. Immediate visual impressions give the viewer the opportunity to concentrate on understanding the larger meaning of a complex set of data, rather than get lost in processing invidual words, numbers, etc. And while that is nothing new, Mr. Paley's Text Arc gives you the opportunity to apply this generally numerically driven concept of information visualization to a freaking book. Powerpower!
Anyhow.
Nerdy end to a very long day.
Narf.

No comments:
Post a Comment